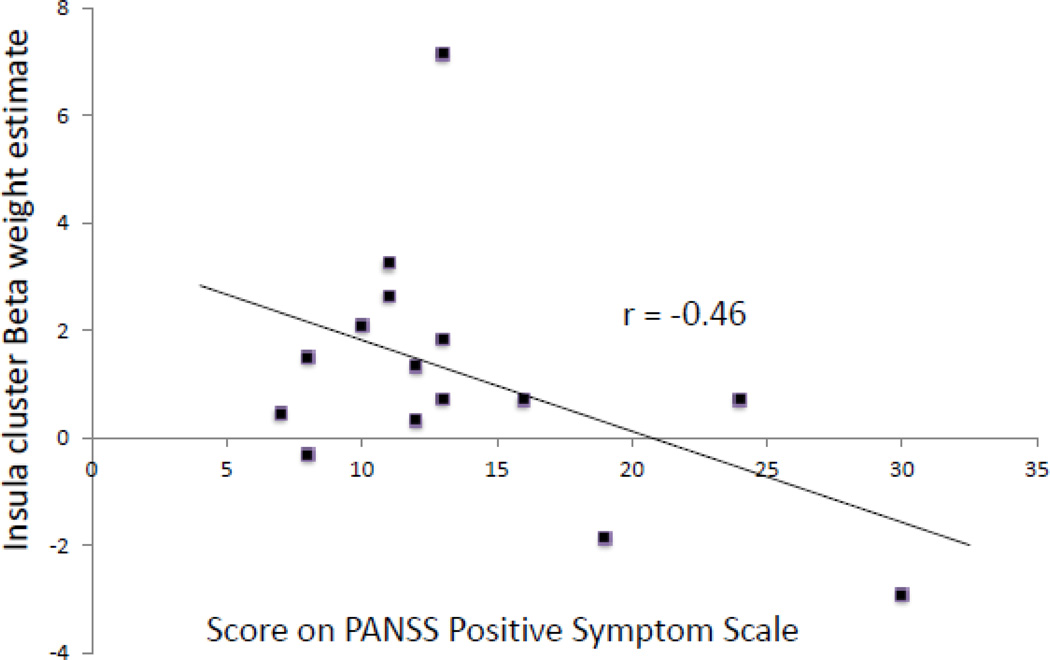
Figure 4.
A scatter plot displaying the negative correlation (r=−0.46, p=0.04) between individual BOLD signal (mean beta weight across all voxels in cluster showing between-group difference, at MNIXYZ −44, −2, 10) in the insula and scores on the PANSS Positive Symptom Subscale in the schizophrenia cohort is shown. PANSS, Positive and Negative Syndrome Scale.

