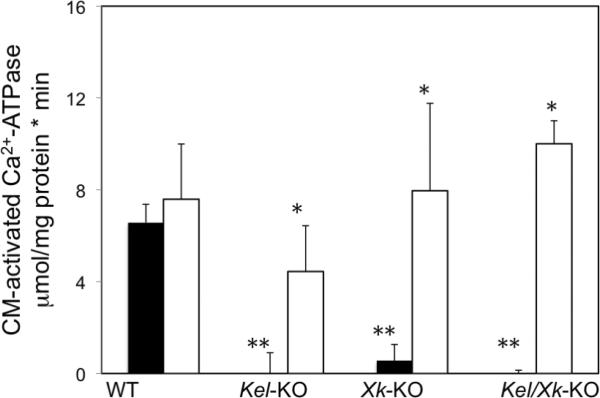
Figure 2. Calmodulin-activated Ca2+ ATPase in mouse erythrocytes.
Ca2+ATPase was measured as described in Material and Methods section in the presence (□) or absence (▪) of 700 nM ET-3. CM = calmodulin. The values are the mean±SD of two experiments in triplicate determinations. WT vs Kel-KO or Xk-KO or double KO, ** p<0.001; Comparison in the presence or absence of ET-3, * p<0.04,

