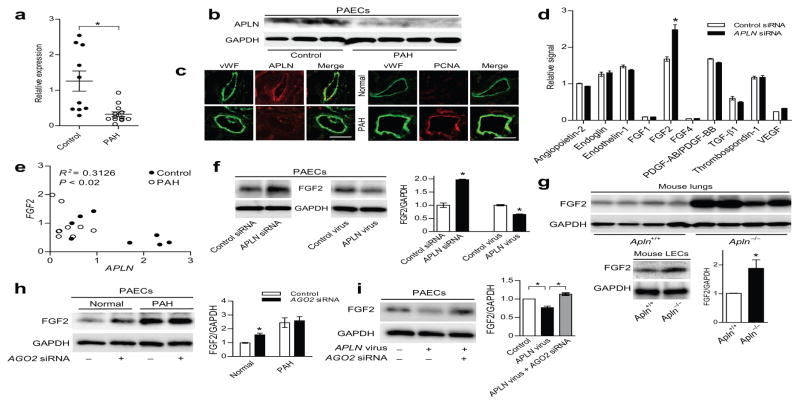
Figure 1. APLN reciprocally regulates FGF2 expression in PAECs in a miRNA dependent manner.
(a) APLN mRNA expression in PAECs of controls and PAH subjects. *P < 0.005 vs. controls. (b) APLN protein expression in PAECs of controls and PAH subjects. (c) Immunofluorescence staining showing APLN expression and PCNA staining in the lung endothelium of a control and a PAH subject. Von Willebrand Factor (vWF) staining is shown in green, APLN and PCNA staining are shown in red. Scale bar = 50 μm. (d) Cytokine array showing relative changes in cytokine expression in response to APLN knockdown in PAECs. *P < 0.01 vs. control siRNA. (e) Correlation between APLN and FGF2 mRNA levels in PAECs from normal controls and PAH subjects. (f) Expression of FGF2 protein in response to either APLN knockdown or lentiviral APLN overexpression in PAECs. *P < 0.01. (g) Expression of FGF2 protein in total lung homogenates and isolated LECs from wildtype and Apln null mice. *P < 0.05. (h) FGF2 expression in response to knockdown of AGO2 in normal and PAH PAECs. *P < 0.01. (i) FGF2 expression in PAECs in response to APLN overexpression and AGO2 knockdown. *P < 0.01.

