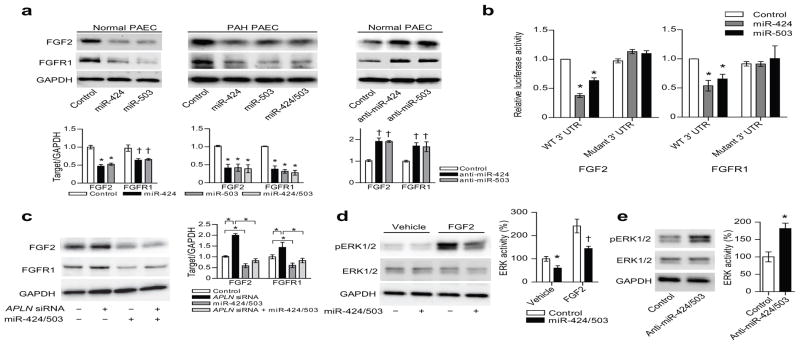
Figure 3. MiR-424 and miR-503 regulate FGF2 and FGFR1 expression and signaling.
(a) FGF2 and FGFR1 protein expression in response to either overexpression of miR-424 and miR-503 in normal and PAH PAECs, and inhibition of miR-424 or miR-503 in normal PAECs. *P < 0.01 and †P < 0.05. (b) Targeting of FGF2 and FGFR1 3′ UTR by miR-424 and miR-503. Both wildtype (WT) and mutagenized 3′ UTR constructs are shown. *P < 0.01 vs. control. (c) FGF2 and FGFR1 expression in response to knockdown of APLN in PAECs with concurrent overexpression of miR-424 and miR-503. *P < 0.01. (d) ERK1/2 phosphorylation in response to overexpression of miR-424 and miR-503 in PAECs, both at baseline and with FGF2 stimulation. *P < 0.05 and †P < 0.01. (e) ERK1/2 phosphorylation with inhibition of miR-424 and miR-503 with anti-miRs in PAECs. *P < 0.01.

