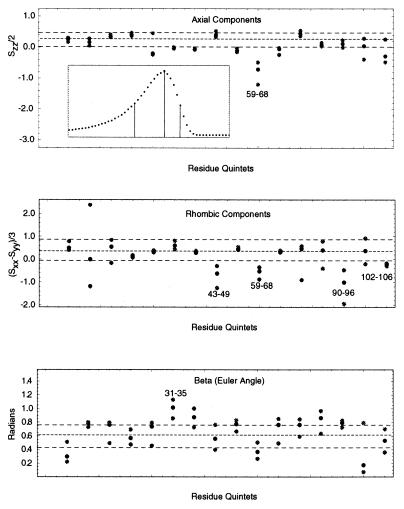
Figure 1.
Examples of Saupe order tensor elements in binase. The filled gray circles represent the flanks of the distribution corresponding to the half maximum height. The filled black circles represent the optimal values corresponding to the maximum heights of the distribution. Three dashed lines denote their average values over the entire protein sequence. These two flanking lines define the confidence limit. The numbers indicate the stretch (quintet) having the tensor values outside the confidence limits. (Top Inset) An example of a non-Gaussian distribution for quintet 102–106. Three vertical lines in the Inset indicate the maximum and its half heights. The x axes indicate the residue quintets used to calculate the tensor whereas the y axes indicate their corresponding values, for the top two panels in units of normalized order parameters (i.e., in units of the global ordering KNHF ).
).

