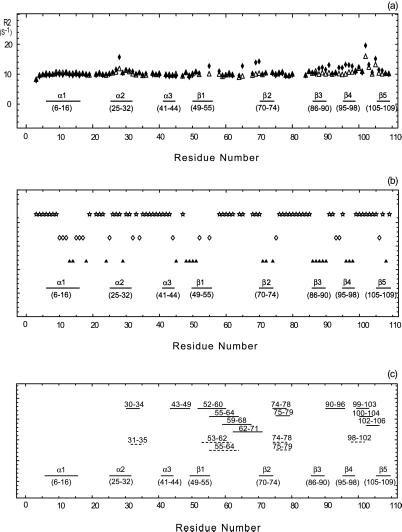
Figure 2.
(a) Conformational exchange in binase. The x axis indicates the amino acid sequence; elements of secondary structure are also indicated. The open triangles and filled diamonds give the 15N R2 relaxation rate with and without a CPMG sequence, respectively. Large values of R2 indicate conformational exchange broadening, caused by molecular motions at the ms-μs time scale. (b) Amide proton/deuterium exchange. A sample of 0.5 mM of 15N-labeled binase was lyophilized and dissolved in D2O. 15N–1H HSQC spectra were recorded with a repetition rate of 22 min. The open stars, open diamonds, and filled triangles give the fast, intermediate, and slow hydrogen exchange rates, respectively. The fastest exchange rate that could be measured was 22 min−1; the slowest 96 h. Fast exchange indicates exposure/mobility. (c) Saupe tensor parameters, derived from residual 15N–1H dipolar coupling parameters in binase, that deviate significantly from the average values, indicating either static or dynamic deviation of the solution conformation from the x-ray structure. Solid lines represent the axial and rhombic components whereas the dashed lines give the Euler angle beta. The numbers above these lines indicate the stretch where the five residues (quintets) are located.

