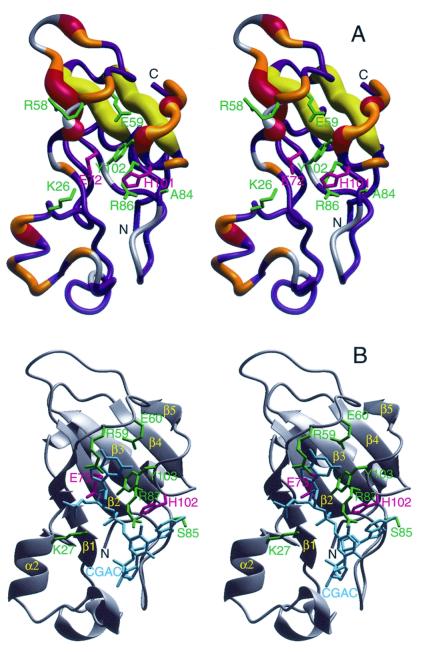
Figure 3.
(A) The crystal structure of binase (18) encoded with the 15N conformational exchange data obtained at 11.7 T (500 MHz 1H). The width of the tube representing the backbone indicates the amount of conformational exchange broadening. The color coding is as follows: gray, no data; blue Rex < 0.5 s−1; orange, 0.5 s−1 < Rex < 1.5 s−1; red and yellow, Rex > 1.5 s−1. The yellow coding indicates that the conformational exchange broadening for the β-strands β3 and β4 may be induced by the flexible loops hovering above it (see text). The side-chains of residues inferred to interact with substrate/inhibitor (see Fig. 3b) are indicated in green; the catalytic residues Glu-71 and His-101 in pink. (B) The crystal structure of barnase complexed with dC-G-A-C (PDB accession code 1BRN; ref. 30) in the same orientation. The DNA is in cyan; the active site residues that interact with this inhibitor are in green, the catalytic residues Glu-72 and His-102 are in pink (the barnase count deviates by one from binase for all these residues because of an insertion at the second residue). The figure was prepared with molmol (18).

