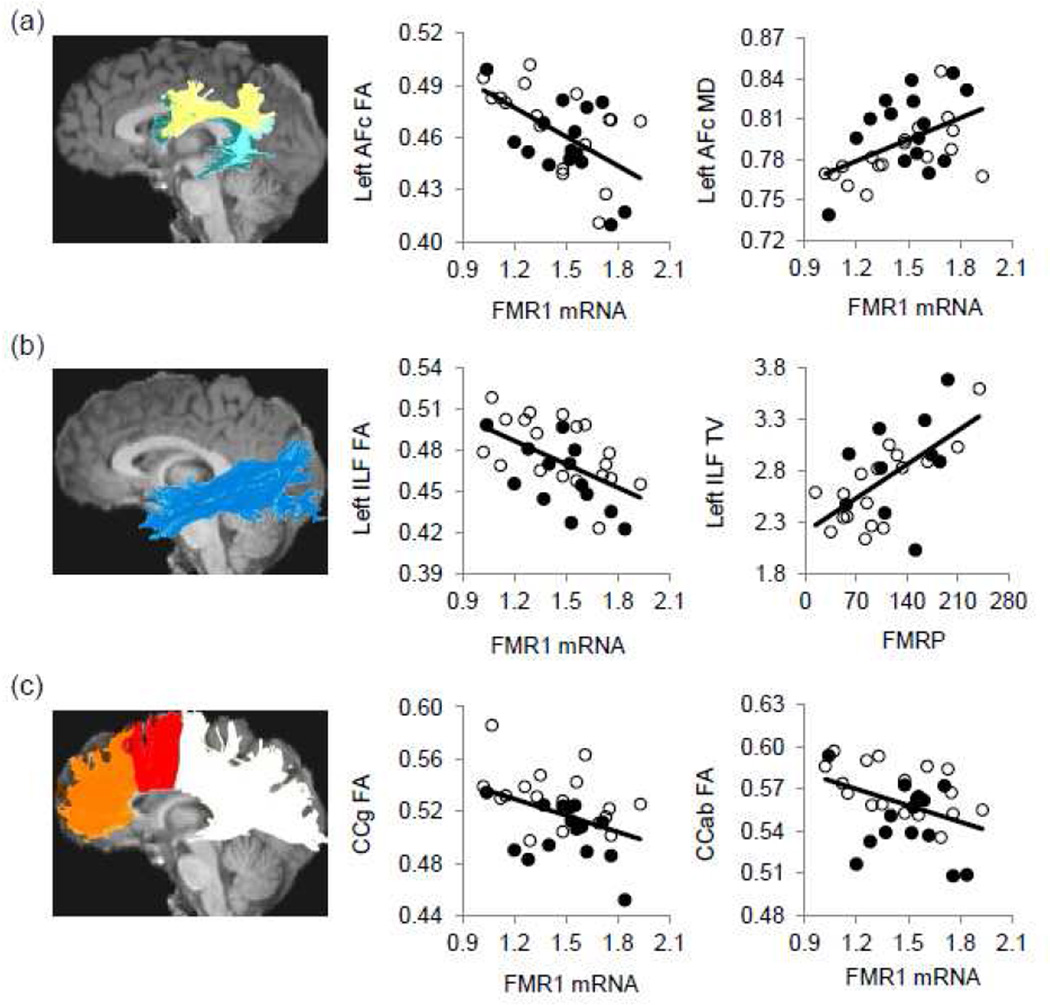
Figure 1.
The reconstructed fiber tracts and their selective associations with the FMR1 gene expression. Fiber tracts are superimposed on a sagittal slice of the T1-weighted image. Only the left side is shown. The original data (without age adjustment) are shown. (a) The arcuate fasciculus complex (AFc) contains three components, namely the anterior (light yellow), posterior (aqua), and direct (dark teal) components. The FA and MD of left AFc showed significant correlation with FMR1 mRNA. (b) The FA of left ILF showed significant correlation with FMR1 mRNA. Its tract volume (TV) showed significant correlation with FMRP. (c) The FA of CCg (orange,) and CCab (red) showed significant correlation with FMR1 mRNA. Measurements of MD are in µm2/ms and tract volume in 1,000 voxels. Black dots, older participants; white dots, younger participants.

