
Figure 6.
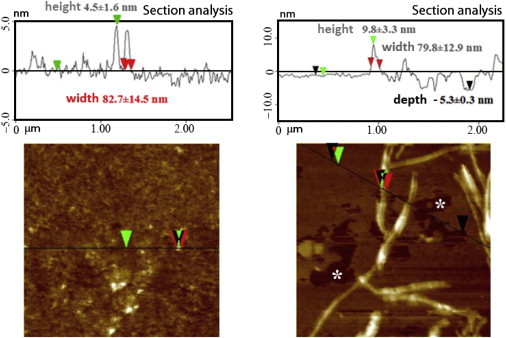
AFM section analysis. (A and B) Structures formed on POPC/POPS (7:3) SLBs after exposure to 2 μM hIAPP (A) or 2 μM hIAPP with 100 μM Ca2+ ions (B) for 24 hr. The zero value refers to the height of the membrane in the absence of hIAPP. Green and red arrows refer to height and width measurements, respectively. Defects on the SLB are evident only in the presence of calcium ions (marked with white asterisks on the AFM image and black arrows in the sectional analysis). All experiments were performed in 10 mM HEPES buffer, 100 mM NaCl, pH 7.4 at 25°C.