
Figure 2.
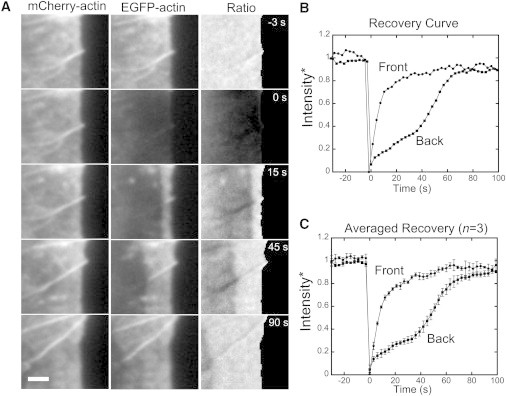
Two-color FRAP experiments on XTC fibroblasts. (A) mCherry-actin and EGFP-actin channels of a lamellipodium segment from Movie S1, and their ratio. EGFP-actin is bleached at t = 0 s. Retrograde flow speed: 0.050 ± 0.005 μm/s. The leading edge of the mCherry channel was tracked using an active contour (30). Image ratio for pixels to the right of the contour set to zero. (Scale bar) 2 μm (B) Recovery of normalized image ratio in the segment of cell in panel A (see Section 4 in the Supporting Material). Front and back measurements are averages over 0–0.5 μm and 2.5–3 μm from the leading edge. (C) Averaged recovery from three separate movies that met our criteria (main text, and see the Supporting Material). Average retrograde flow speed, 0.056 μm/s. (Error bars) SD.