
Figure 4.
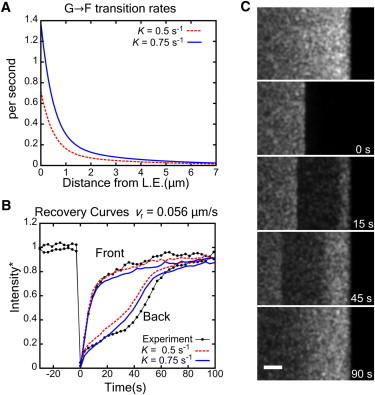
Simulated FRAP results in model with monomers as only diffuse actin species. (A) Calculated monomer transition rate as a function of distance from the leading edge for two different F/G values (vr = 0.056 μm/s as in the average of Fig. 2C). (B) Comparison of simulated recovery curves to experiment of Fig. 2C at 0–0.5 μm (front) and 2.5–3 μm (back) from leading edge, for two K values. Simulated intensities are normalized to the steady-state value at the bleached position and approach 1 at sufficiently long times. (C) Image of simulated FRAP. Size of bleached region 5 × 20 μm and K = 0.5 s−1, vr = 0.056 μm/s. Simulated exposure 500 ms/frame with 2500-ms lag between frames. (Bar) 2 μm.