
Figure 1.
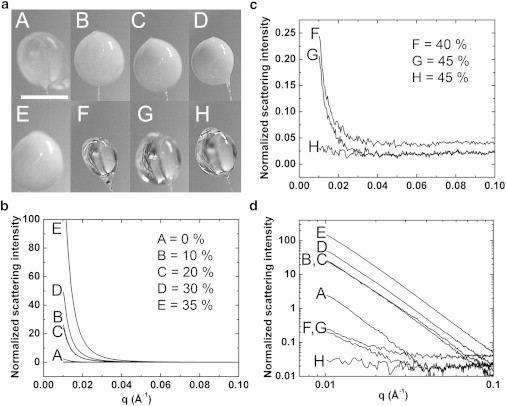
Cryoprotectant concentration required to obtain an ice-free scattering curve. (a) Photographs of ∼1 μL drops of PEG 200—water mixtures held in ∼700 μm nylon loops after cooling to 100 K in a N2 gas stream. PEG concentrations for drops (A–H) ranged from 0% to 45% (w/w) (indicated in the legends of (b) and (c)). Opacity of the drop arises from light scattering by ice crystals. (b) SAXS curves show increasing scattering intensity at as the PEG concentration increases from 0% to 35% (w/w). (c) At 40% (w/w) PEG and above the drops are visually clear and the intensity drops dramatically. However, scattering at low-q values still shows the presence of small amounts of ice. Using 45% (w/w) (drop H), the excess low-q scattering is absent. (d) The scattering curves from (b) and (c) are shown on log-log axes, revealing the characteristic power-law scattering of ice crystallites at all concentrations.