
Figure 2.
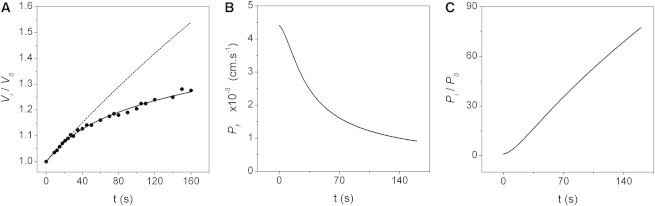
VPfM contrasted with a typical osmotic experiment in X. laevis oocytes with hAQP1. (A) Time course of experimental (dots) and simulated (lines) relative volumes. The osmotic gradient (∼140 mM) was created by diluting the external solution. The experiment was done using the EOO technique. The continuous line is the best-fitted response simulated with the variable water permeability model (VPfM). The only parameter in this model is , which is modified by relative pressure according to Eq. 2. The best-fitted for this experiment is 0.0043 cm·s−1. was determined by the model according to Eq. 3, shown in Fig. 1C. The dashed line is the osmotic response predicted by the constant model (CPfM), using the value obtained by fitting Eq. 1 up to 10 s (0.0040 cm·s−1). All initial data for simulations (except ) were obtained from the experiment. (B) Time course of obtained from the simulation shown in A. A transition in the water pathway from an open to a closed state seems to occur. (C) Time course of the relative internal pressure obtained in the same simulation.