
Figure 3.
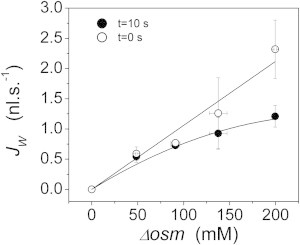
Relationship between simulated fluxes and osmotic gradients. Water fluxes were obtained at 10 s (solid dots) and at the beginning of the osmotic challenge (open dots) from simulations shown in Fig. 4. At 10 s, the relationship between and is nonlinear, just as experimentally observed (8). However, through simulation it is also possible to analyze initial values (open dots), where this relationship is linear, just as predicted by Eq. 1 (R2 > 0.96).