
Figure 4.
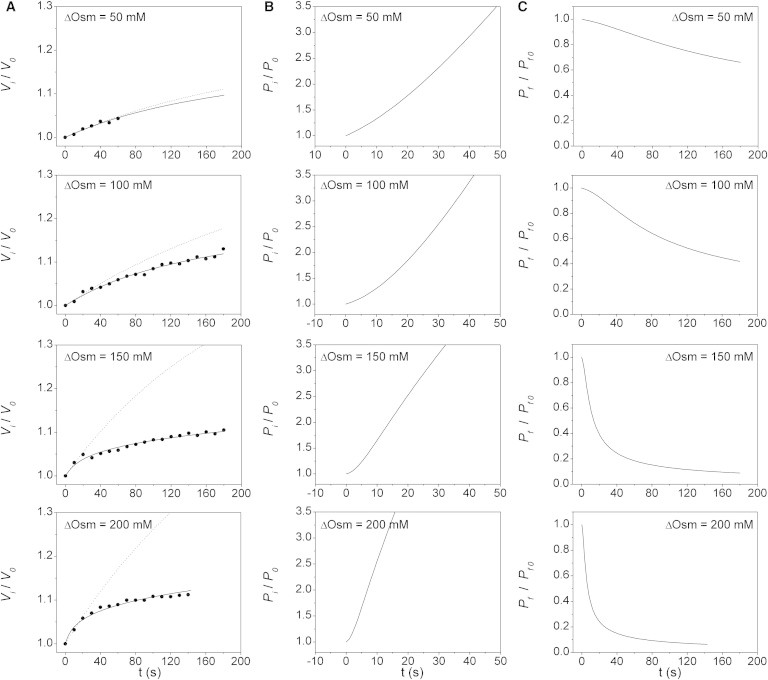
VPfM contrasted with osmotic experiments using mannitol gradients of different magnitude in X. laevis oocytes with hAQP1. (A) Time course of experimental (dots) and simulated (lines) relative volumes obtained with four gradients of different magnitudes (∼50, 100, 150, and 200 mM mannitol). Continuous lines are the best-fitted responses simulated with the VPfM. The obtained values are 0.0028, 0.0019, 0.0033, and 0.0035 cm·s−1, respectively. Dashed lines are the predicted responses obtained with the CPfM, using the best-fitted value obtained with Eq. 1 up to 10 s. These values are 0.0023, 0.0021, 0.0032, and 0.0020 cm·s−1, respectively. (B) Time courses of obtained in simulations shown in A. Pressure changes seem to occur faster with higher gradients. (C) Time courses of obtained in simulations shown in A. The water pathway transitions from open to closed states occur faster with higher gradients. In all cases, indicates the initial osmotic difference.