
Figure 3.
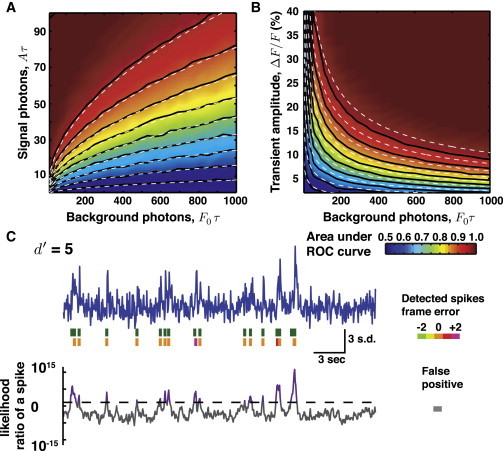
Spike detection with modest photon counts. When the number of photons collected from signal and background sources is insufficient to justify Gaussian approximations, the treatment involving d′ is not guaranteed to be valid. To explore this regime, we randomly sampled the log-likelihood ratio distributions of Eq. 6, computed the ROC curves, and calculated the underlying areas. The area under the ROC curve is plotted as a joint function of background and signal photons, (A), or of background photons and ΔF/F (B). (Dashed lines) Areas under ROC curves determined using the d′ calculation, demonstrating the robustness of the calculation result despite the invalidity of the Gaussian approximation. The contours in both plots are spaced in 0.05 increments of area under the ROC curve. (Note that unlike in Fig. 1D, the x-axes are on a linear scale.) As expected, the agreement between the direct calculations and the d′ approximation degrades as the condition A/F0 ∼ ΔF/F ≪ 1 is relaxed. This leads to a maximum disagreement of ∼0.025 in the area under the ROC curve. (C) Simulated trace plotted using the same conventions as in Fig. 2. Simulation parameters: ΔF/F = 0.75, τ = 0.15 s, ν = 20 Hz, spike rate λ = 0.5 Hz. Probability of detection is 0.96 and the expected number of false positives is 0.36.