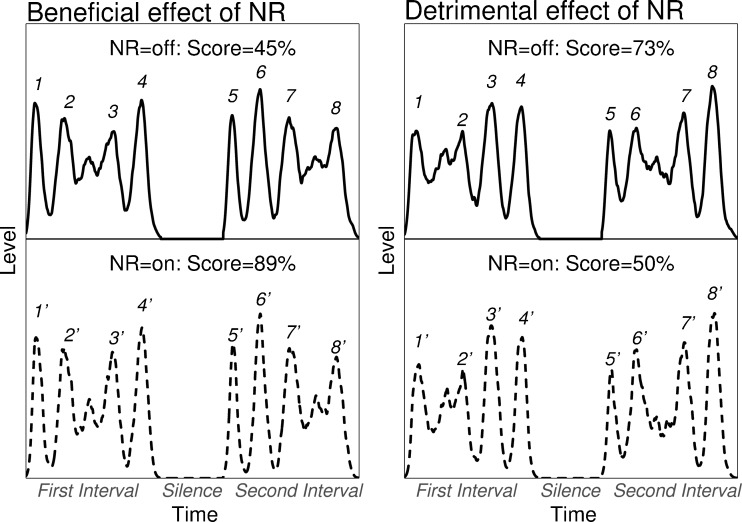
FIG. 3.
Pairs of envelope patterns that produced the most beneficial (left panel) and the most detrimental (right panel) effects of NR with an SNR of +12 dB. Each panel shows the AM patterns for a particular trial (i.e., the first and the second intervals separated by a silent interval). The top-left panel shows the pair of AM patterns that produced an average score of 45 %, with NR off and this increases to an average scores of 89 % with NR on (shown in the bottom-left panel). The top-right panel shows the pair of AM patterns that produced an average score of 73 %, with NR off and this decreases to an average scores of 50 % with NR on (shown in the bottom-right panel). Numbers indicate the peaks within the pattern of each trial, see text for details.

