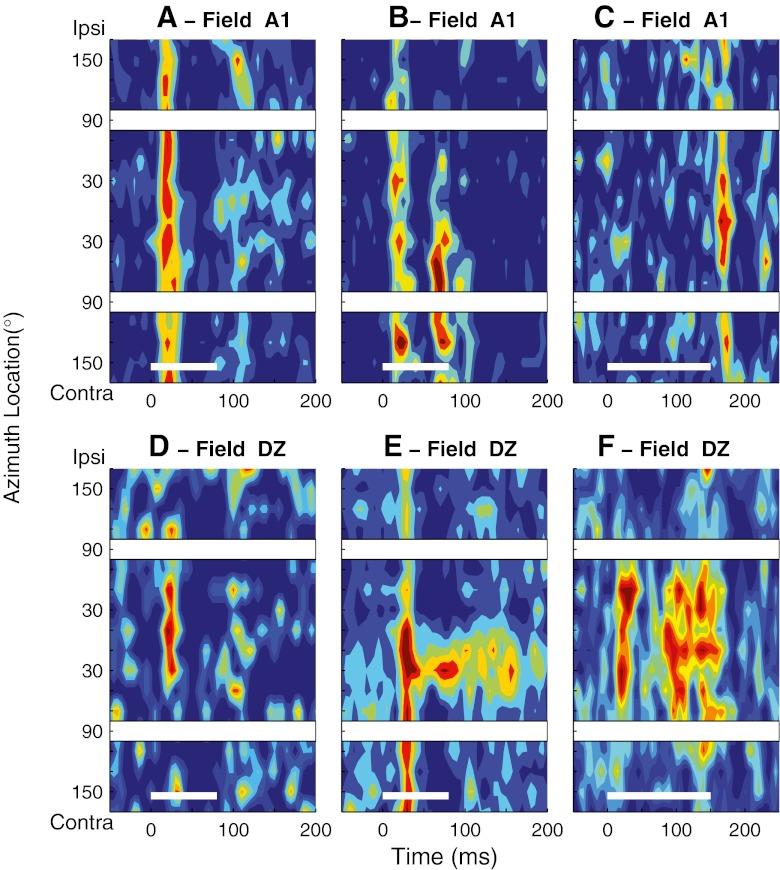
Fig. 1.
Poststimulus time histograms (PSTHs) showing normalized mean spike rates (colors) as a function of time (horizontal axis) and head-centered stimulus azimuth (vertical axis). In each plot, the thin white lines at the bottom of the plots indicate the 80- or 150-ms stimulus duration. White gaps crossing the plots correspond to spatial bins centered at ipsilateral and contralateral 90 °, which were omitted from analysis. These PSTHs represent units studied in the Idle condition. A–C Three units recorded in field A1. Maximum mean multiunit spike rates were 10.7, 11.4, and 5.7 spikes/s based on 22–43, 17–28, and 13–34 trials at each location in A, B, and C, respectively. D–F Three units recorded in field DZ. Maximum mean multiunit spike rates were 7.0, 37.9, and 13.5 spikes/s based on 18–27, 21–44, and 29 to 55 trials at each location, respectively.

