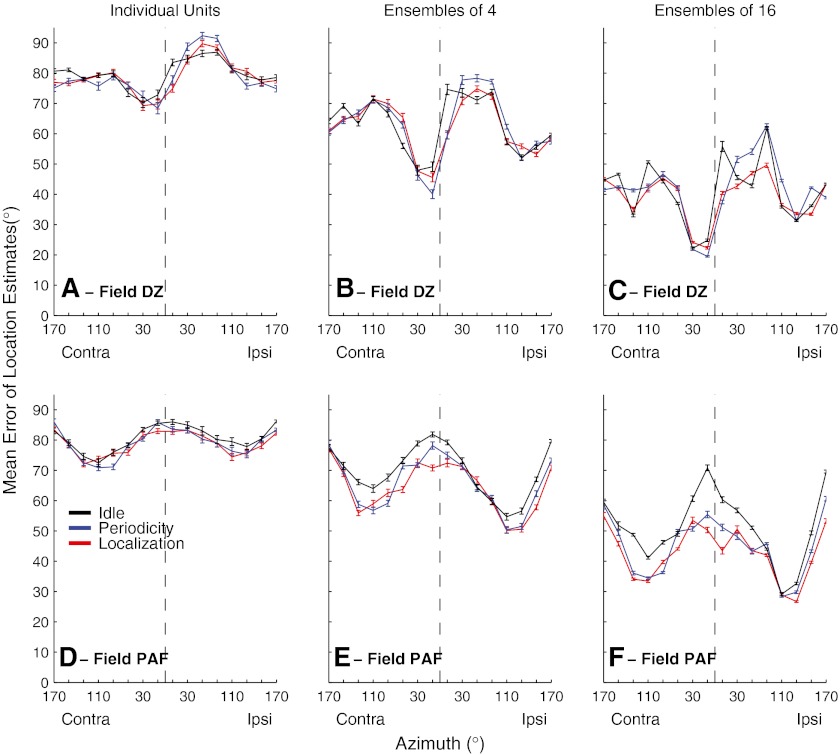
FIG. 13.
Mean errors of location estimates based on spike patterns of DZ (A to C) and PAF (D to F) units, selected as described in the text. Line colors indicate behavioral conditions, as indicated. Panels indicate results from individual units (A) (D) or randomly formed ensembles of four (B) (E) or 16 (C) (F) units. Error bars represent the standard error of the mean across estimations from 24 (a) or 47 (D) individual units or from 100 randomly selected ensembles (B, C, E, F).

