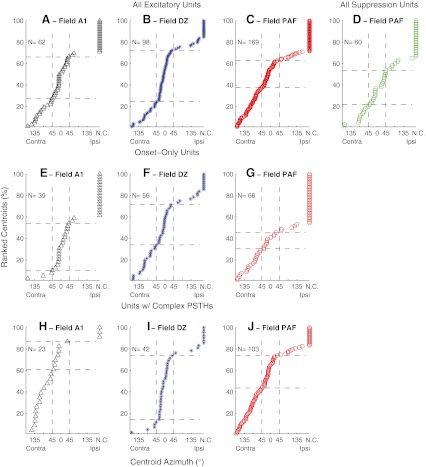
Fig. 4.
Distributions of centroid locations. Each unit is represented by a symbol indicating the best-area centroid. Units for which no centroid (NC) could be computed are represented by symbols placed at the right edge of each plot. Units are ordered by best-area centroids. Horizontal dashed lines indicated the percentages of the populations in each condition having centroids within 45 ° of the frontal midline. The various panels show units recorded in various fields and showing various response patterns. A, B, C All units in fields A1, DZ, and PAF having any PSTH component showing excitation to sounds. D All units in field PAF showing primarily suppression or an offset response to sounds. E, F, G Units in fields A1, DZ, and PAF showing an onset response and little or no long-latency response. H, I, J Units in fields A1, DZ, and PAF having PSTHs containing onset and long-latency responses. The number of units (N) represented in each panel is indicated.

