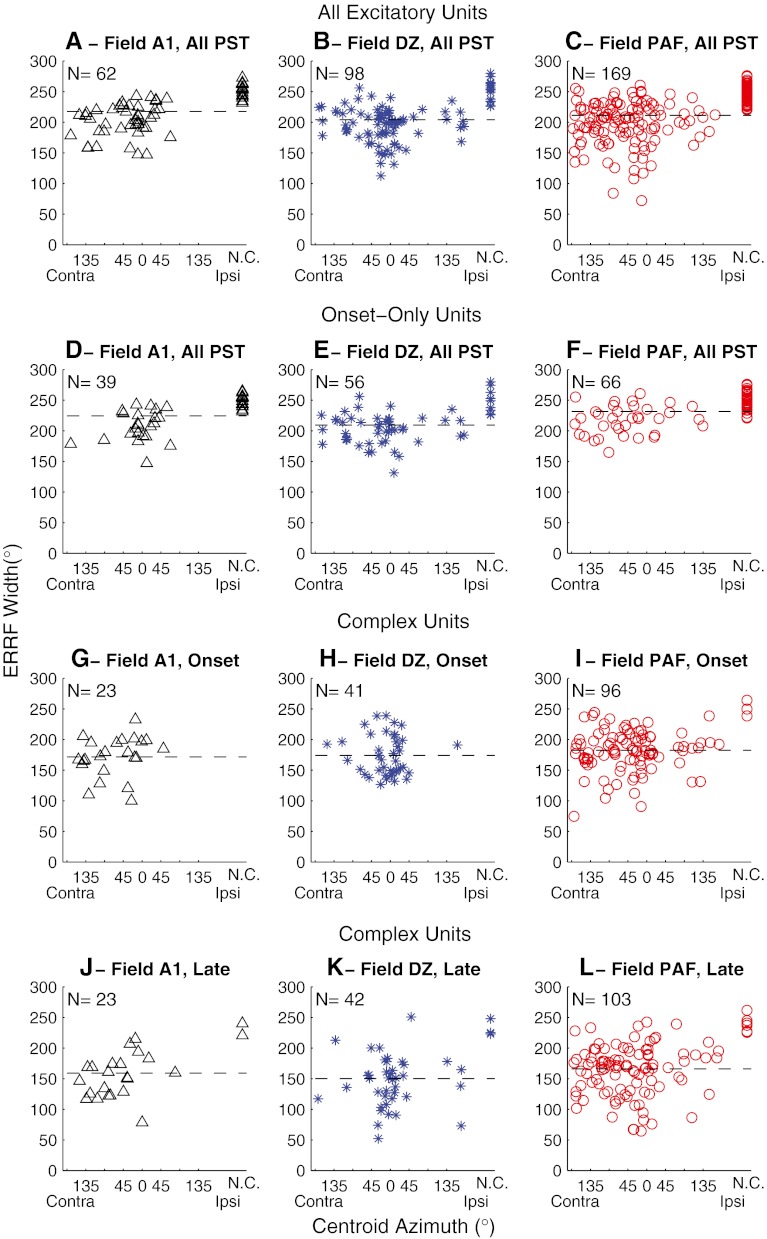
FIG. 5.
Breadth of spatial tuning represented by widths of equivalent rectangular receptive fields (ERRFs). The ERRF width of each unit is shown as a function of its centroid azimuth. The horizontal dashed line in each panel indicates the mean ERRF. The top row of panels (A, B, and C) represent ERRF widths computed from full recording durations (indicated “All PST”) from all units that showed an excitatory response to sounds. The second row represents units having onset-dominant responses. The third and fourth rows represent only the units that had complex PSTHs containing long-latency components. G, H, and I show ERRF widths computed from only the onset responses, whereas J, K, and L show ERRF widths computed from only the long-latency (indicated as “Late”) responses. Among the complex units, one DZ unit and seven PAF units had robust long-latency responses but inconsistent onset responses. Those units are represented in K and L but not H and I.

