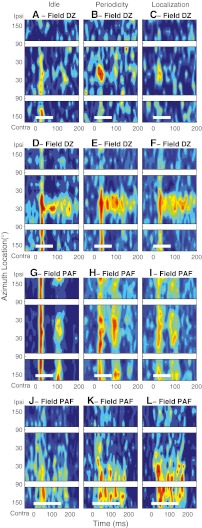
Fig. 6.
Task-dependent modulation of response pattern and spatial sensitivity in DZ and PAF. Each row of PSTHs represents data from one unit studied in three behavioral conditions during one recording session. Left, middle, and right columns of panels represents the Idle, Periodicity Detection, and Localization conditions, respectively. The color map is equalized across the three task conditions for each unit such that any particular color indicates the same spike density (spikes per time and location bin) across the three panels in each row. a–f Two DZ units. Maximum mean multiunit spike rates were 6.7, 9.2, 5.1, 37.9, 37.2, and 35.7 spikes/s based on 23–47, 20–47, 9–34, 21–44, 20–50, and 23–52 trials at each location. g–l Two PAF units. Maximum mean multiunit spike rates were 25.6, 32.9, 27.6, 17.8, 37.2, and 18.5 spikes/s based on 29–60, 30–60, 29–63,29–48, 28–52, and 24–46 trials at each location. Plot conventions as in Fig. 1

