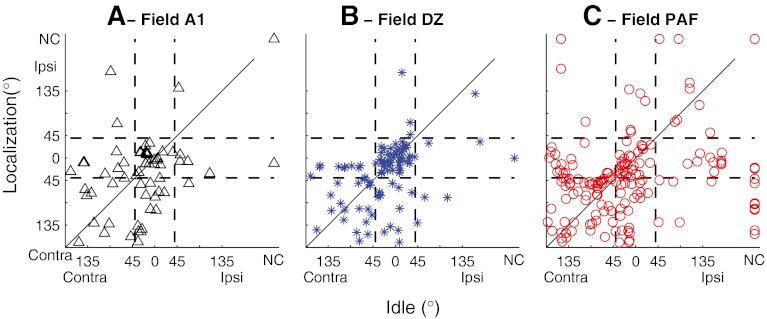
Fig. 7.
Comparison of locations of best-area centroids in Idle versus Localization conditions. Centroids were computed from onset spike counts, falling between 10 and 40 ms after stimulus onset. Vertical and horizontal lines indicate loci of centroids within 45 ° of the frontal midline. Panels indicate data from field A1, DZ, or PAF, as indicated. NC indicates units for which no centroid was computed because spike rates showed less than 50 % modulation by stimulus location.

