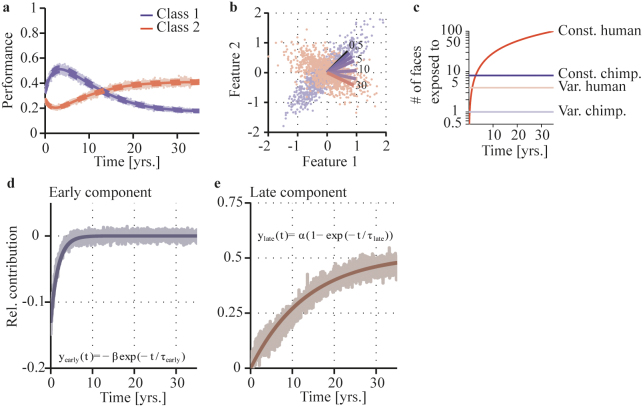
Figure 2. Simulation using simplified neuronal model.
a, Face discrimination performance of a neuronal model following the Oja-learning rule42, trained on numeric values representing face features. Performances from 200 simulation runs are plotted as a function of time (yrs.), showing a decrease for class 1 (blue) (equivalent to chimpanzee faces) and a gradual increase for class 2 (red) (equivalent to human faces). Solid lines indicate the means, dashed lines the standard errors. The raw data is plotted in light colors. b, The distributions of the input feature space of the two classes. Lines indicate the approximation from class 1 (blue) to class 2 (red) in time (yrs). The dots indicate the distributions of exemplars of the two classes from which individual exemplars were selected during the simulation. The neuronal model gradually aligns the coding dimension (weight vector) from class 1 to class 2. c, Illustration of the number of constantly and variably presented exemplars of both classes (y-axis logarithmically scaled) over time. d, e, Relative contribution of processes in early and late phases of development. The relative contribution of early and late components to face perception, as suggested by this simulation, is shown as a function of time. The closest fitting function is indicated by the solid line; the raw data is plotted in light colors.

