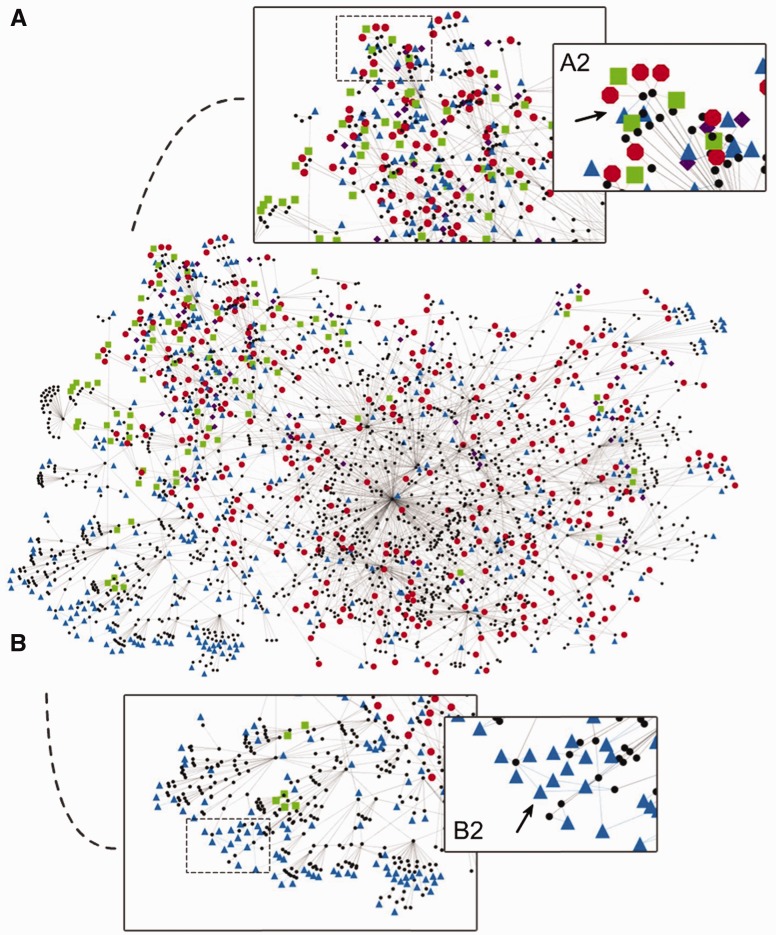
Figure 1.
Cytoscape visualization showing the HAO full ontology network (black circle nodes and gray lines) with correspondences mapped from the other arthropod anatomy ontologies: SPD (purple diamonds); TADS (green squares); TGMA (red octagons); FBbt (blue triangles). Box A represents an area of general agreement between the ontologies, showing multiple correspondences from each ontology (largely consisting of CARO and many general body classes); further magnification (A2, represented by dashed box in A) reveals nodes with many correspondences from different ontologies (arrow). Box B represents an area with fewer correspondences, mainly from FBbt with some TADS (largely consisting of specific muscle classes not present in TGMA and SPD); further magnification (B2, represented by dashed box in B) reveals instances where one class from FBbt is aligned to multiple HAO classes (arrow; many to one relationship).

