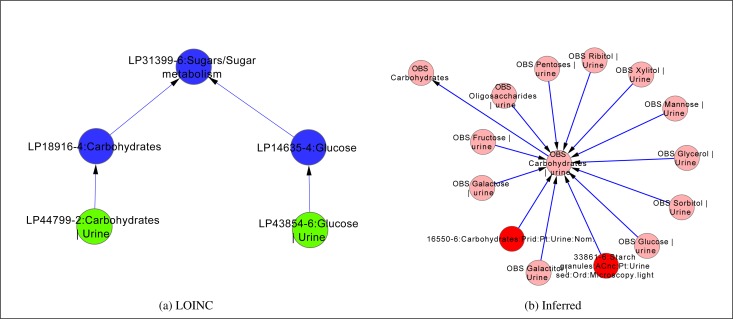
Figure 3:
Paths between Carbohydrates | Urine and Glucose | Urine observations in LOINC multiaxial and inferred hierarchies. LOINC codes are shown in red, abstract observations in pink, MULTIAXIAL parts in green, and COMPONENT parts in blue. Edges represent is_a (subClassOf ) relations. [created in Cytoscape22]

