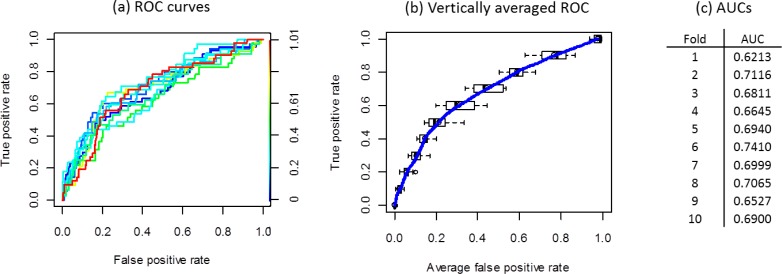
Figure 8.
The discrimination performance of DPP-SVMs is the same as that of the centralized SVM, with precision O(10−6), using the hospital discharge data set. The three subfigures correspond to (a) the ROC curves of 10 folds, (b) vertically averaged ROC curve with standard deviations for false positive rates, (c) AUC for all 10 folds of both SVMs (i.e., distributed and centralized). Note that the color bar in (a) indicates cutoff values for different ROCs.

