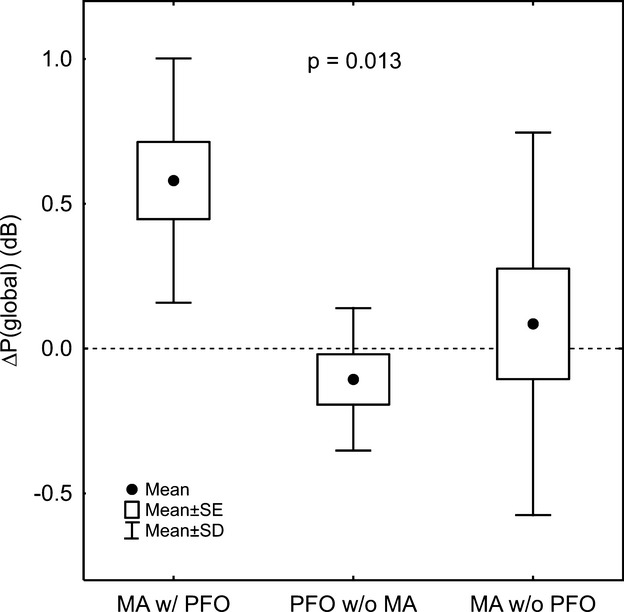
Figure 2.

Mean global changes in total EEG spectral power induced by microbubble injections for each group. Total spectral power differences at all electrode locations were summed to obtain the global changes (decibels) for each patient and then the group averages were calculated. MA w/ PFO group was significantly different from the other groups (P=0.013). MA indicates migraine with aura; PFO, patent foramen ovale.
