
Figure 8.
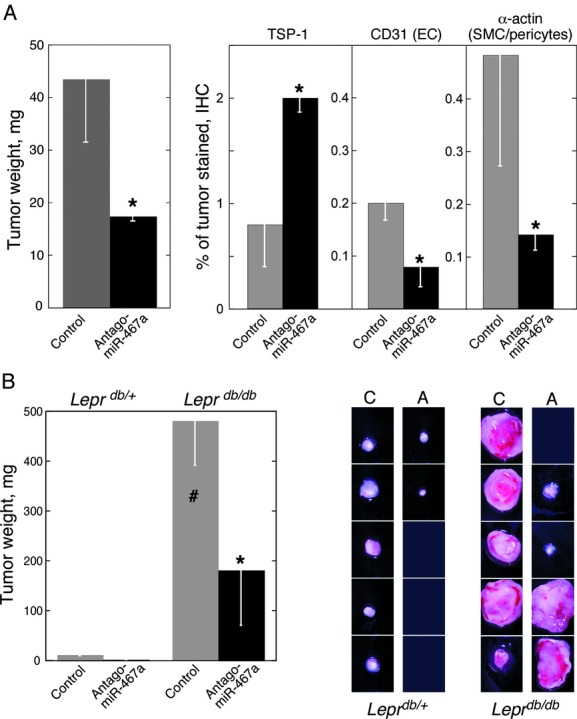
miR‐467 regulates breast cancer growth in Leprdb/db hyperglycemic mice. A, EMT6 cells stably expressing the antisense antagonist of miR‐467 or a control ribooligonucleotide were injected subcutaneously into STZ‐treated hyperglycemic or normoglycemic mice. Tumors were weighed, stained with anti‐TSP‐1, anti‐CD31, and anti‐α‐actin antibodies. Mean±SEM, *P<0.05 compared with tumors expressing control oligonucleotide (control). Sample size: mice with tumors expressing control ribooligonucleotide (control), n=15; mice with tumors expressing antagomiR‐467, n=16. To quantify immunohistological staining, FOV images were generated and analyzed as described in Methods. B, EMT6 cells stably expressing the antisense antagonist of miR‐467 or a control ribooligonucleotide were injected subcutaneously into hyperglycemic Leprdb/db or normoglycemic Leprdb/+ mice as described in Methods, and tumors were weighed (in milligrams). Mean±SEM, *P<0.05 compared with tumors expressing control oligonucleotide (control), #P<0.05 compared with normoglycemic (Leprdb/+) mice, n=5. Right panel, photographs of individual tumors excised from Leprdb/db and Leprdb/+ mice: C=EMT6 producing control oligonucleotide; A=EMT6 producing miR‐467 antagonist. STZ indicates streptozotocin; TSP, thrombospondin; FOV, field of view; SEM, standard error of mean.