
Figure 4.
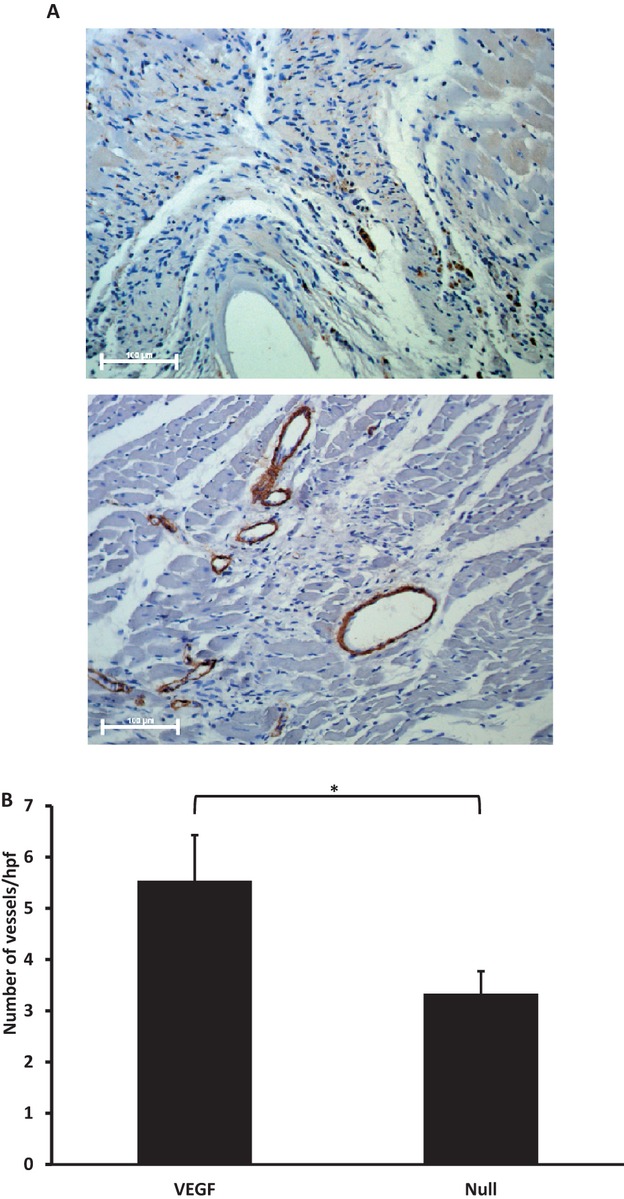
Myocardial vascularization studies. Vascularization of infarct regions assessed by staining for α‐smooth muscle actin in sections obtained as described in Methods and Results 7 weeks after coronary ligation and administration of AdVEGF‐All6A+ or the control vector AdNull. A, Photomicrographs of representative sections of infarct zones viewed at ×200 after administration of AdNull/GMT (top) or AdVEGF‐All6A+/GMT (bottom). Bars represent 100 μm. B, Quantification of vascularization of infarct regions as assessed by the number of vessel per high power (×200) microscopic field (n=12/group). *P<0.05. VEGF indicates vascular endothelial growth factor; GMT, Gata4, Mef2c, and Tbx5.