
Figure 5.
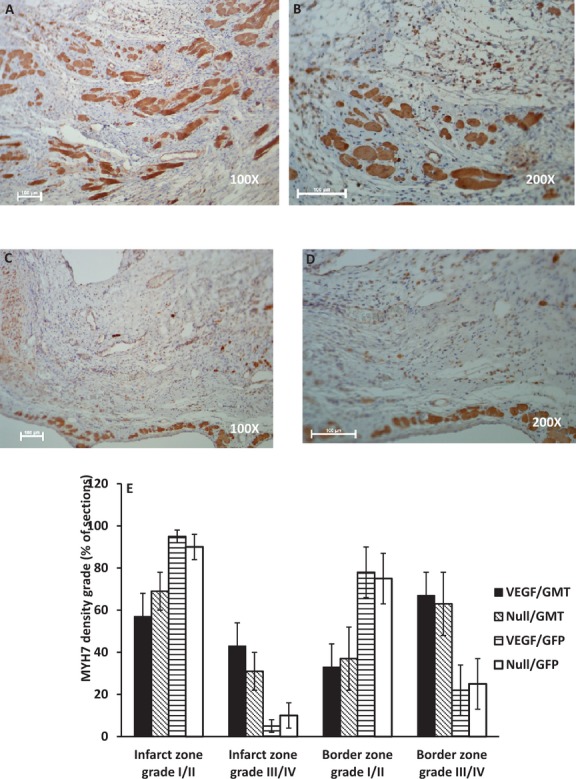
Cardiomyocyte density in infarct zones. Cardiomyocyte‐specific marker MYH7 staining of the infarct and border zones of sections of myocardium harvested 7 weeks after coronary ligation and administration of AdVEGF‐All6A+ or the control vector AdNull (4 weeks after the administration of lentivirus encoding GMT or a GFP control). A through D, Photomicrographs of representative sections of infarct zones from animals treated with AdVEGF‐All6A+/GMT (top row) or/AdNull/GFP (bottom row) at ×100 (left) and ×200 (right) magnification, respectively. Bars represent 100 μm. E, Depiction of MYH7 cell density as a percent of total sections analyzed (n=6/group). Grade I/II indicates than <50% of the examined microscopic fields were occupied by MYH7+ cells; grade III/IV indicates than >50% of the examined microscopic fields were occupied by MYH7+ cells (see Methods and Results for definitions and Figure 1 for microscopic fields representative of each density grade). MYH7 indicates myosin heavy chain 7; VEGF, vascular endothelial growth factor; GMT, Gata4, Mef2c, and Tbx5; GFP, green fluorescent protein.