
Figure 7.
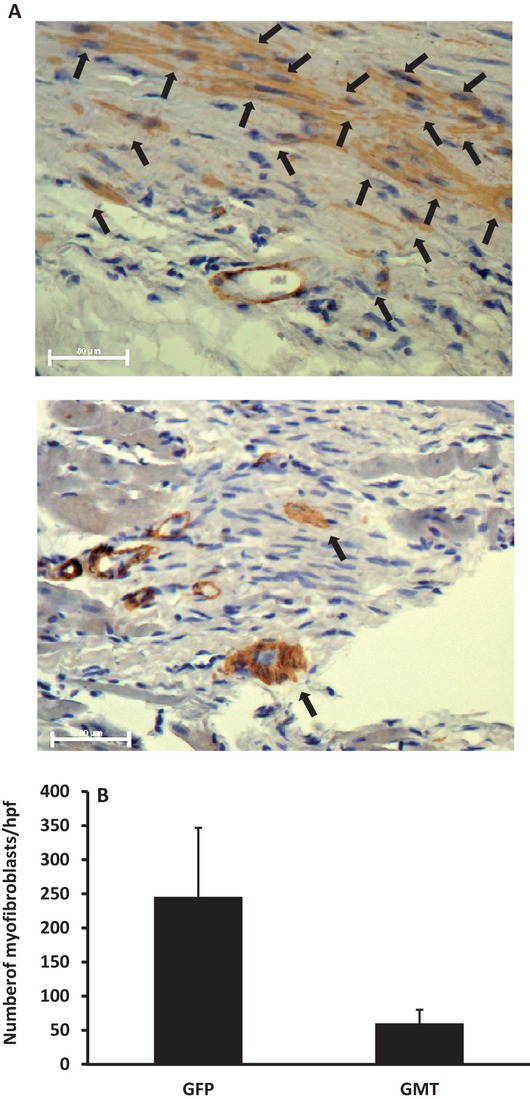
Myofibroblasts. Myofibroblasts identified by nonvascular α‐smooth muscle actin staining of the infarct and border zones of sections of myocardium harvested 7 weeks after coronary ligation and administration of AdVEGF‐All6A+ or the control vector AdNull (4 weeks after the administration of lentivirus encoding GMT or a GFP control). A, Photomicrographs of representative sections of infarct zones viewed at ×400 after administration of AdNull/GFP (top) or AdVEGF‐All6A+/GMT (bottom). Arrows depict cells identified as myofibroblasts. Bars represent 50 μm. B, The number of myofibroblasts identified per microscopic field (×200) in animals receiving GMT versus GFP control vectors (n=12), as identified by staining for α‐smooth muscle actin (P=0.09). GFP indicates green fluorescent protein; GMT, Gata4, Mef2c, and Tbx5; VEGF, vascular endothelial growth factor.