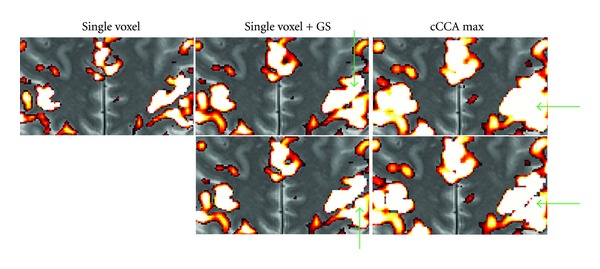
Figure 8.

Magnified motor activation maps from Figure 6 for selected analysis methods (single voxel without Gaussian smoothing, single voxel with Gaussian smoothing (GS), and CCA with the maximum constraint (cCCA max)). The top row shows the original images at FWE <0.05 without any correction for the smoothing artifact. The bottom row shows the original images corrected for the smoothing artifact. The green arrows point to major differences of the activation patterns. Note that correction for the smoothing artifact leads to a splitting of activation pattern in the left (radiological convention) motor cortex (see bottom row images with green arrows pointing to the ROI).
