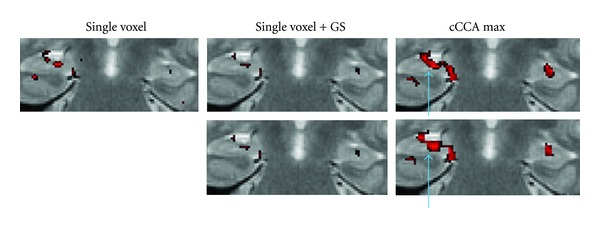
Figure 9.

Magnified memory activation maps from Figure 7 for selected analysis methods (single voxel without Gaussian smoothing, single voxel with Gaussian smoothing (GS), and CCA with the maximum constraint (cCCA max)). The top row shows the original images at FWE <0.05 without any correction for the smoothing artifact. The bottom row shows the original images corrected for the smoothing artifact. The blue arrows point to major differences of the activation patterns. Note that hippocampal activation after correction for the smoothing artifact appears to have three separate foci in the right temporal lobe (radiological convention) as shown in the bottom image on the right (blue arrow).
