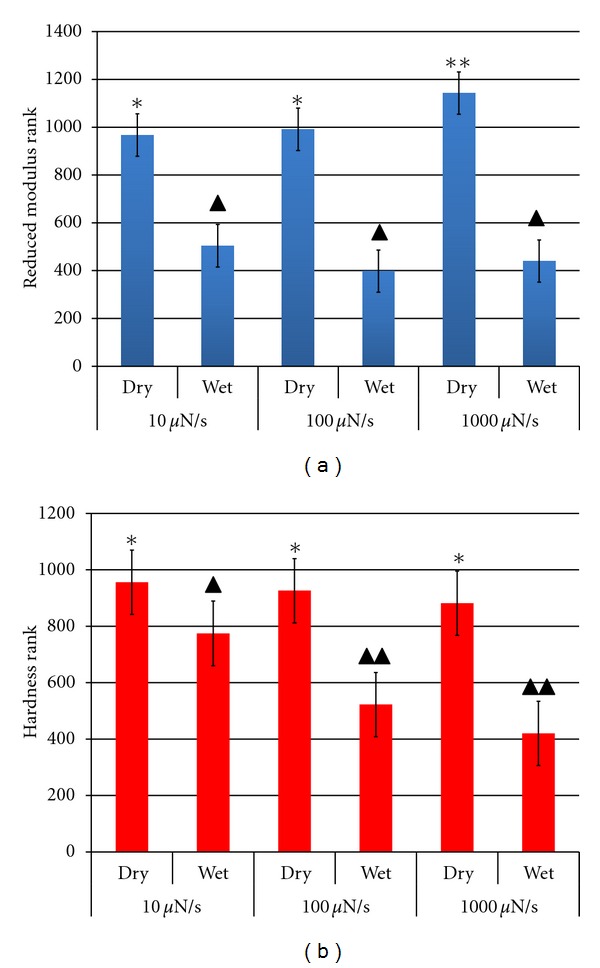
Figure 3.

(a) Elastic modulus and (b) hardness ranks averaged over six specimens for each condition (wet, dry) and loading/unloading rate (10, 100, and 1000 μN/s). Bars represent 95% confidence intervals. Different asterisks number/color show significant differences between groups (P < 0.001).
