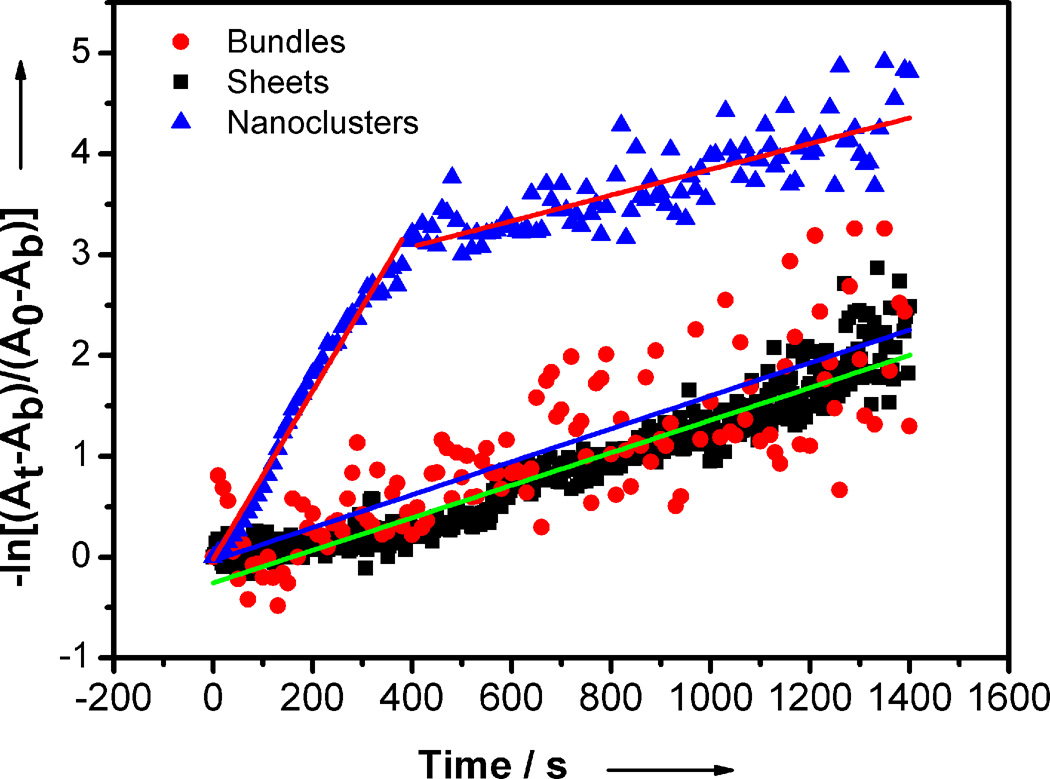
Figure 6.
Kinetic data from the MeOH-induced growth of (CdSe)13. The pseudo-first-order plots were constructed by monitoring the (CdSe)13 absorbance at 350 nm, where At is the absorbance at time t, A0 is the absorbance at t = 0 s, and Ab is the background absorbance measured at t = 1800 s. The slopes were extracted by linear least-squares fitting. The red circles and blue line correspond to bundled [(CdSe)13(n-octylamine)13]; the black squares and green line to exfoliated [(CdSe)13(n-octylamine)x(oleylamine)13-x] sheets; and the blue triangles and red lines to free [(CdSe)13(oleylamine)13] nanoclusters.

