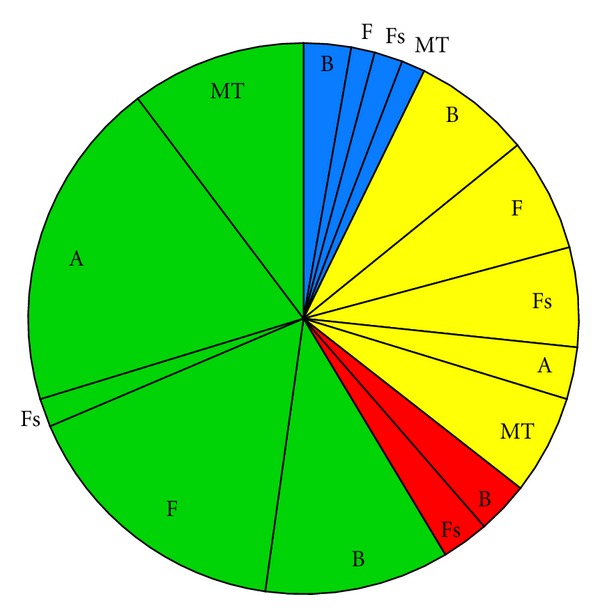
Figure 7.

Pie chart representing the proportion of impacts for each ecosystem component for Impact scenario i6, wave energy project, categorized by whether the effect is positive (blue), minor negative (green), moderate negative (yellow), or major negative (red). B = Benthic habitat and resources; F = Fish; Fs = Fisheries; A = Avian species; MT = Marine mammals and sea turtles.
