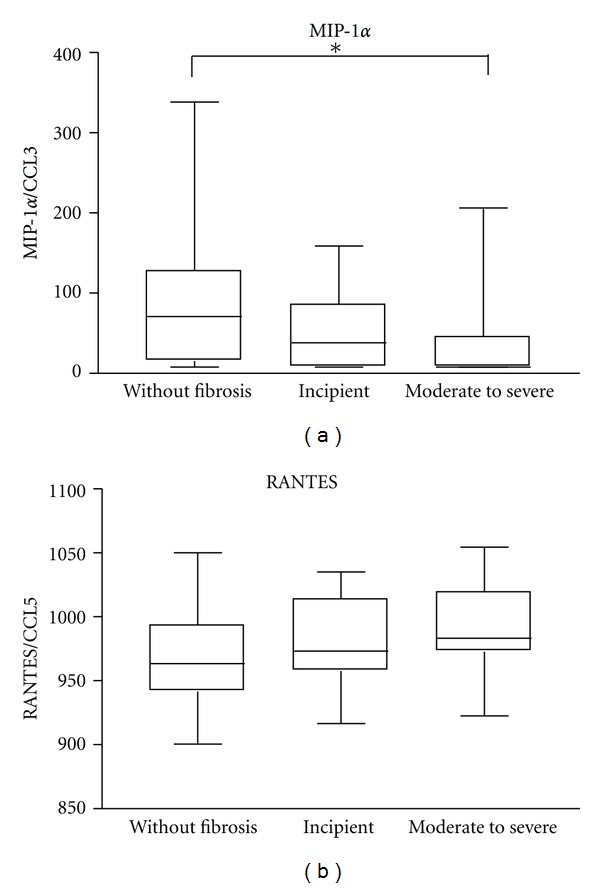
Figure 2.

Serum chemokine levels in schistosomiasis individuals with different degrees of periportal fibrosis: (first box) individuals without fibrosis (n = 30), (second box) incipient fibrosis (n = 25), and (third box) moderate to severe periportal fibrosis (n = 17). Levels of MIP-1α and RANTES were determined by sandwich ELISA technique. Horizontal lines represent the median values, boxes represent the 25th to the 75th percentiles, and vertical lines represent the 10th to 90th percentiles. Asterisks indicate statistically significant differences (P < 0.05; ANOVA).
