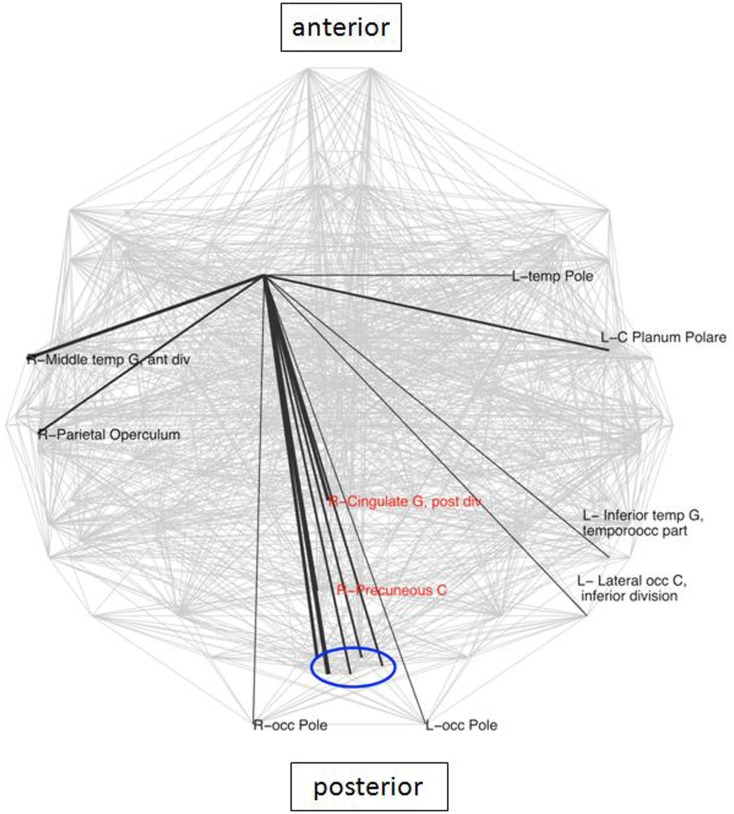
Figure 4.
Areas with significantly different frequencies of right caudate connections between the groups (z-score > 2) superimposed on the whole brain connectivity (projected onto one axial plane), averaged for all subjects in each group (pale gray lines). LLD-related increases in black, decreases in red (note: only connections shared in the two groups were taken into account), R\L, right\left hemisphere; G, gyrus; front, frontal; occ, occipital.

