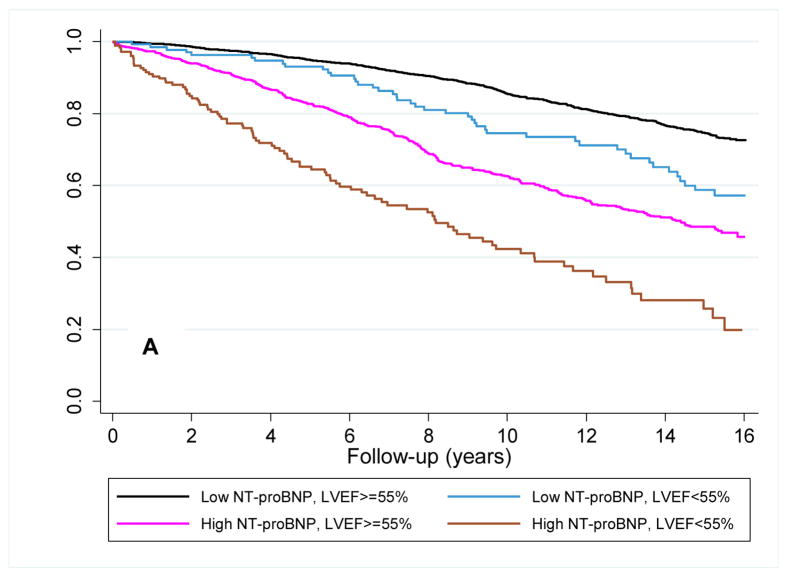
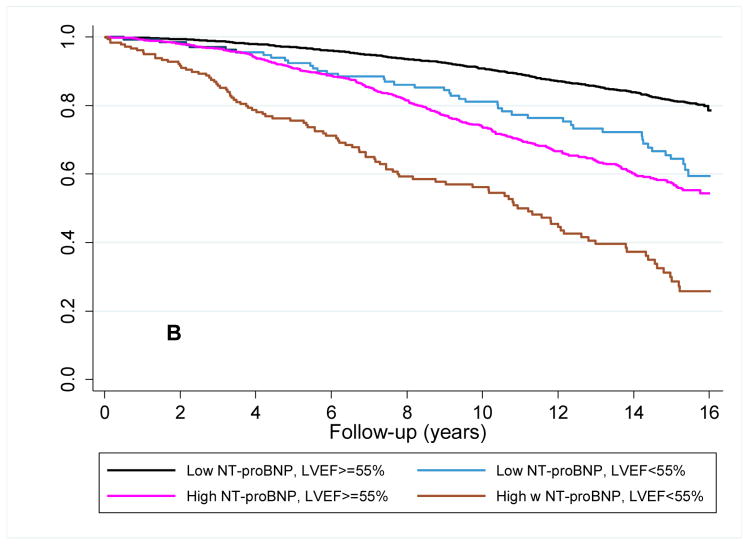
Figure 2. Survival plots for outcomes utilizing baseline LVEF and NT-proBNP level.
Unadjusted Kaplan-Meier plots for (A) time to new-onset HF diagnosis and (B) time to cardiovascular mortality based on the combination of a baseline low (<190 pg/mL) or high (≥190 pg/mL) NT-proBNP and normal or abnormal LVEF. Abbreviations as in Figure 1. p<0.001 for comparison of survival curves for both HF and cardiovascular mortality.


