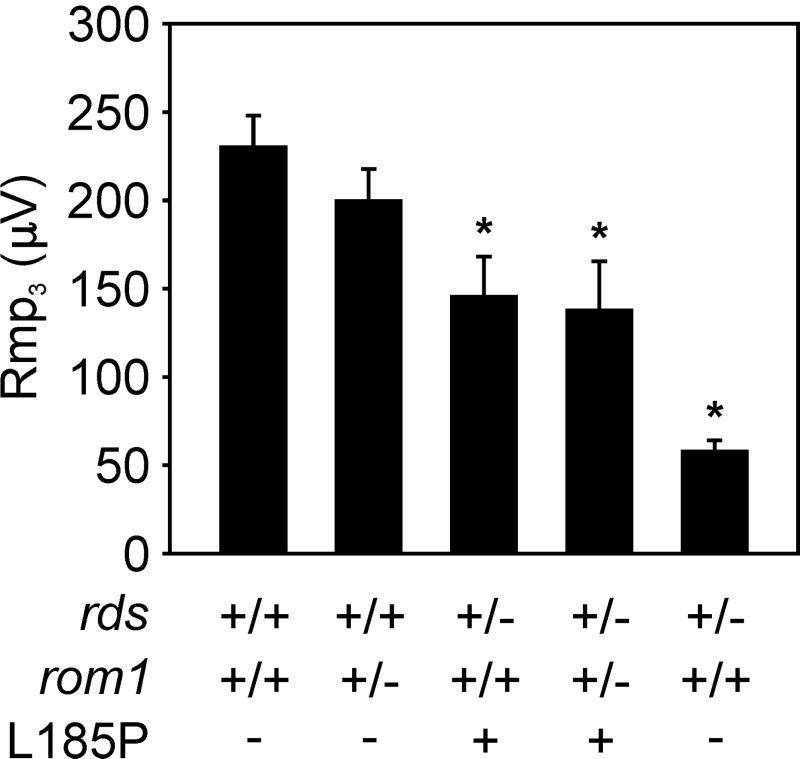
Figure 4.
Electroretinographic analysis. ERGs were performed on five to 7-month-old mice of the genotypes: wild-type (n = 13), rom1+/− (n = 11), L185P rds+/− (n = 3), digenic (n = 7), and nontransgenic rds+/− (n = 8). Average values of Rmp3 for mice of the indicated genotypes are plotted in microvolts (μV ± SEM). An asterisk above the data bar denotes a significant difference from the wild-type value of Rmp3 (Student's t test; P < 0.01).

