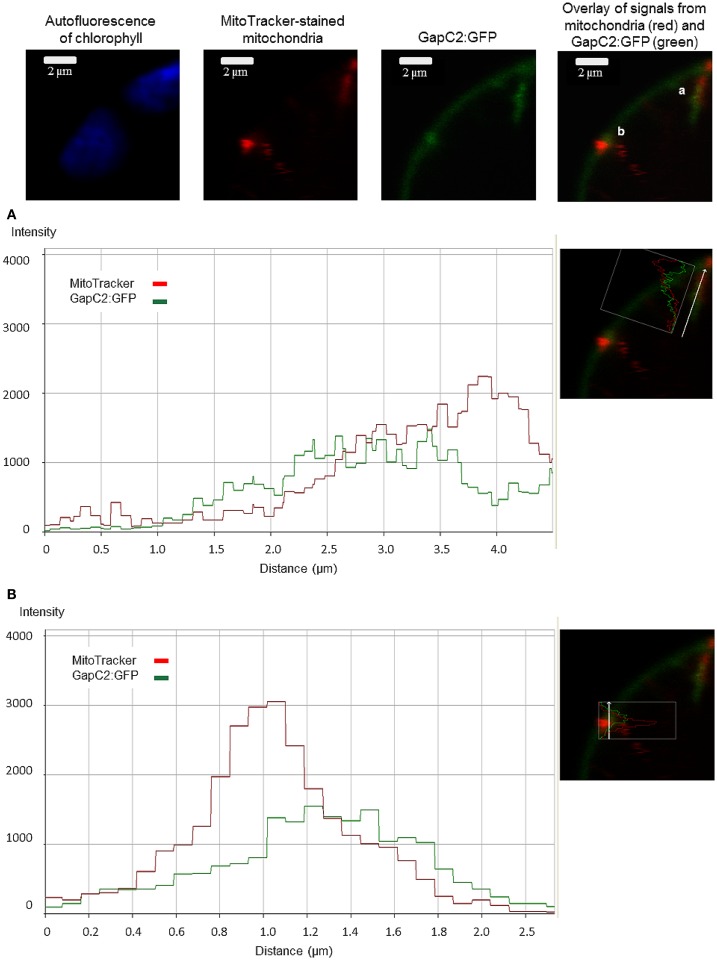
Figure A1.
Colocalization analysis of GAPDH (GapC2) with mitochondria. The magnified section of the protoplast expressing GapC2:GFP displays regions of a possible association of the glycolytic enzyme with the mitochondrion, stained with 50 nM MitoTracker® Orange CMTMRos (Molecular Probes). The diagrams show the colocalization analysis using fluorescence-intensity profiles of both fluorescent signals (A,B).

