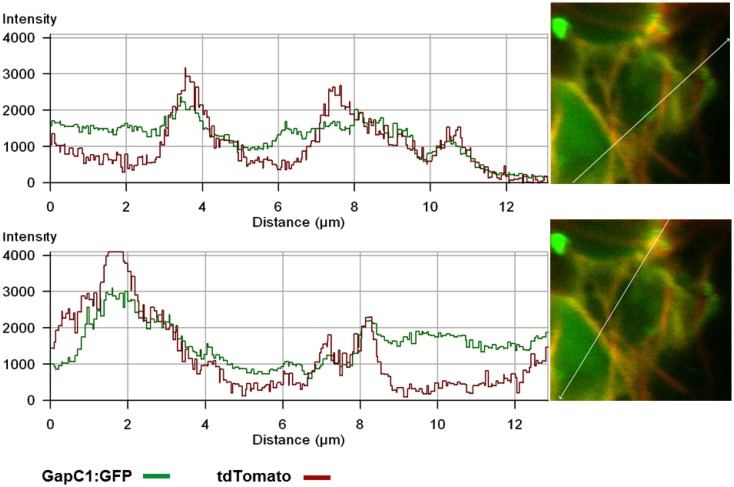
Figure A4.
Overlap of fluorescence emission from tdTomato-Fimbrin and GapC-GFP. Fluorescent signals of GapC1:GFP and F-actin, stained with tdTomato:AtFim1-ABD2, were analyzed with the fluorescence-intensity profile. The GapC1:GFP protein seems to bind the stained actin filaments in the plant cell, since the plotted fluorescent signals partially cover the same regions along a distance of approximately 12 μm. The diagram was performed with the Zeiss LSM 5 software.

