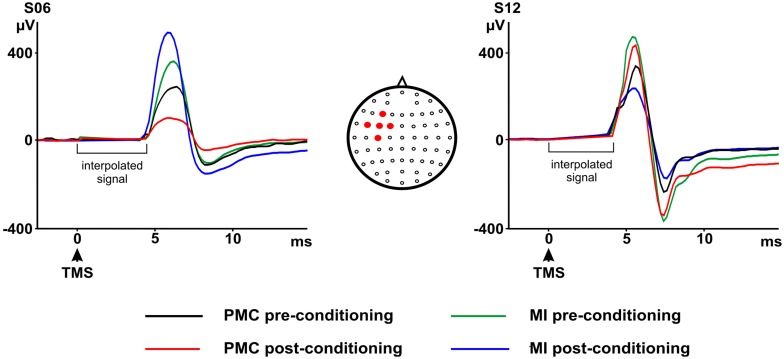
Figure 3.
P5 and N8 pre- and post-primary motor cortex (MI) or premotor cortex (PMC) conditioning as recorded from the marked electrodes. On the left a representative participant showing a decrease in P5 and N8 amplitudes after PMC conditioning and an increase in P5 and N8 amplitudes after MI conditioning. On the right a representative participant showing an increase in P5 and N8 after PMC conditioning and the opposite result after MI conditioning. Electrodes montage is also shown on the upper right side of the figure. Filled circles indicate five electrodes from which the P5-N8 average signal was calculated.

