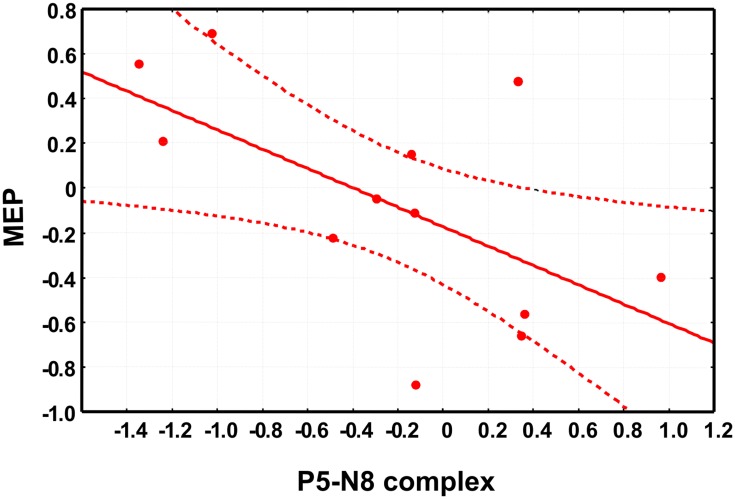
Figure 4.
The scatter plot shows the significant negative correlation between the changes in motor-evoked potentials (MEPs) amplitude, on the x-axis and the changes in P5-N8 complex amplitude. Note that negative values indicate a reduced amplitude of P5-N8 complex or a reduction of MEPs amplitude after the conditioning session (see main text for details about data analysis).

