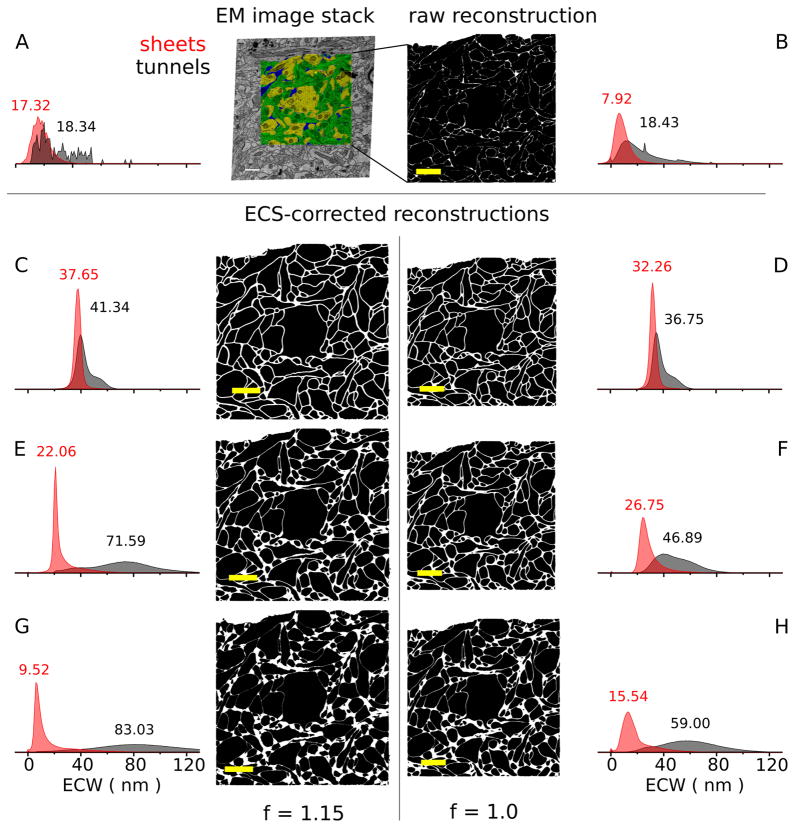
Figure 2.
Sheet-and-tunnel model of extracellular space allows exploration of ECS lacunarity. A: Normalized histogram of extracellular width for sheets and tunnels, and arbitrary EM image from stack partially segmented with contours. Inset numbers represent median values of the distributions. The median extracellular width for tunnels was 17 nm (4,965 measurements) for sheets, and 18 nm (151 measurements) for tunnels, somewhat wider than the sheets, as observed by Van Harreveld et al. (1965). B: Virtual slice through the raw reconstruction with ICS rendered black and ECS as white. The median sheet extracellular width distribution was 8 nm (N = 1,756,847), smaller than observed in EM images, suggesting a bias in contour placement toward the extracellular side. All virtual slices in B–H are at the same location in the stack as A. C–H: Virtual slices through six reconstructions, built from the raw reconstruction, covering a range of ECS lacunarity values, but with nearly identical extracellular volume fraction of 0.2 (0.202 ± 0.003). C,E,G: Half of the reconstructions were scaled by 15% along three orthogonal axes to account for shrinkage associated with the tissue preparation protocol used here. The reconstructions in B–D had similar median values for sheet and tunnel extracellular width (ECW) distributions. These provide a lower bound on ECS lacunarity. Expanding the tunnel ECS volume (E–H) at the expense of the sheet ECS volume, to maintain constant extracellular volume fraction, increased the lacunarity of the ECS and broadened the tunnel extracellular width distributions. The integral of each sheet (red) and each tunnel (black) relative frequency histogram was normalized to one. Scale bar = 1 μm in A–H.

