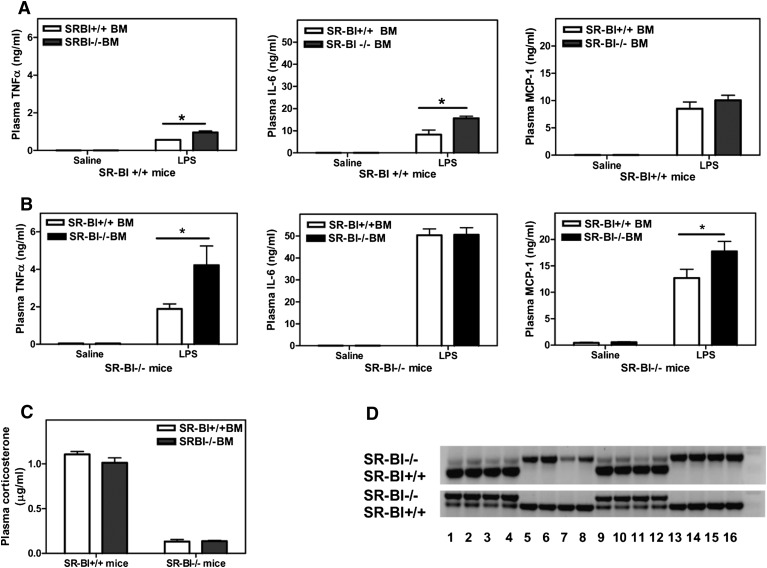
Fig. 1.
Inflammatory response to LPS following bone marrow transplantation. Bone marrow cells from male SR-BI+/+ or SR-BI−/− mice were transfused into irradiated male (A) SR-BI+/+ and (B) SR-BI−/− mice through tail-vein injection. After 4 weeks of recovery on antibiotics, recipient SR-BI−/− and SR-BI+/+ mice were injected intraperitoneally with 0.25 μg/g body weight (A) or 0.1 μg/g body weight (B) of LPS. Mice were euthanized after 2 h. Plasma cytokine levels were determined by ELISA. (C) Plasma corticosterone levels were determined by RIA kits. Values shown are the mean ± SD, n = 5 mice/group. (D) Bone marrow cell DNA was analyzed for the presence of SR-BI+/+ and SR-BI−/− alleles by PCR. (Top panel) Lanes 1–4 and 9–12 SR-BI −/− mice receiving SR-BI +/+ bone marrow cells; lanes 5–8 and 13–16 SR-BI −/− mice receiving SR-BI−/− cells. (Bottom panel) Lanes 1,2,3,4, 9,10,11,12 SR-BI+/+ mice receiving SR-BI −/− bone marrow cells; lanes 5–8 and 13–16 SR-BI +/+ mice receiving SR-BI +/+ cells. (Upper band) Gene product from SR-BI −/− genotype. (Lower band) Gene product in SR-BI +/+ genotype. *P < 0.05, WT versus SR-BI KO.

