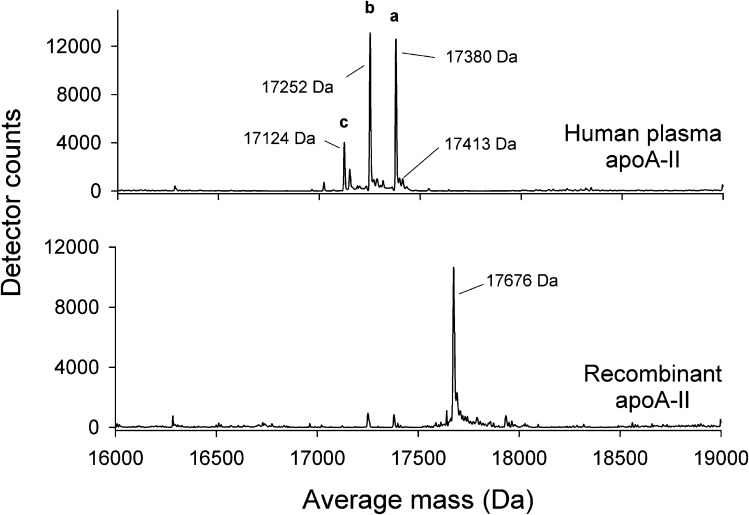
Fig. 3.
Top-down mass spectrometry analysis of human plasma purified and recombinant apoA-II. Protein samples were injected into a HPLC system equipped with a C18 column. The column flow-through was electrosprayed into a QStar XL mass spectrometer. Mass spectra at 18 min retention time are shown. Top: Human plasma apoA-II showing three major peaks. Bottom: Recombinant apoA-II showing a single major peak. Observed average masses resulting from the proteins are reported in Da. The mass accuracy of the instrumentation in this molecular mass range is ±2 Da.

