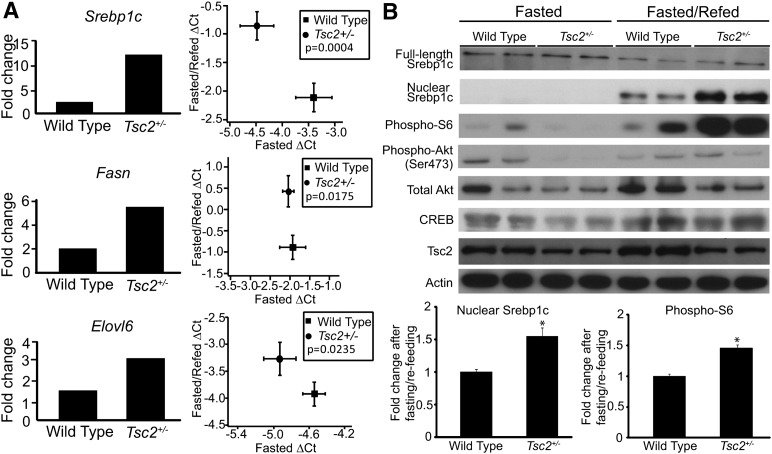
Fig. 3.
Lipogenic gene expression in wild-type and Tsc2+/− mouse livers. Wild-type and Tsc2+/− mice were fasted for 24 h or fasted for 24 h and refed for 8 h before being euthanized (n > 6 in each group). A: The amount of Srebp1c, Fasn, and Elovl6 mRNA was measured by real time-PCR. The difference in the induction of gene expression after fasting and refeeding procedure between wild-type and Tsc2+/− animals is presented in two ways: (1) mRNA levels from fasted animals were set to be one, and mRNA levels from fasted and refed animals were compared with the fasted group to obtain the fold difference in expression; and (2) the ΔCt value of mRNA level from fasted animals was plotted against the ΔCt value from fasted and refed animals. B: Western blotting was performed on the liver tissues described in (A) to detect Srebp1c and phosphorylated S6 ribosomal protein, phosphorylated Akt (Ser473), and total Akt. The Akt levels in three more WT mice were measured and compared with the first mouse (Supplementary Figure I). The levels of phospho-S6 ribosomal protein were measured in 25 more animals on four separate blots (Supplementary Figure II). The intensity of nuclear Srebp1c and phospho-S6 blots (including the blots not shown in the figure) was measured, and the protein level after fasting and refeeding was compared with the protein level in fasted state. The fold change is expressed as a bar graph. CREB and actin blots serve as loading controls.

