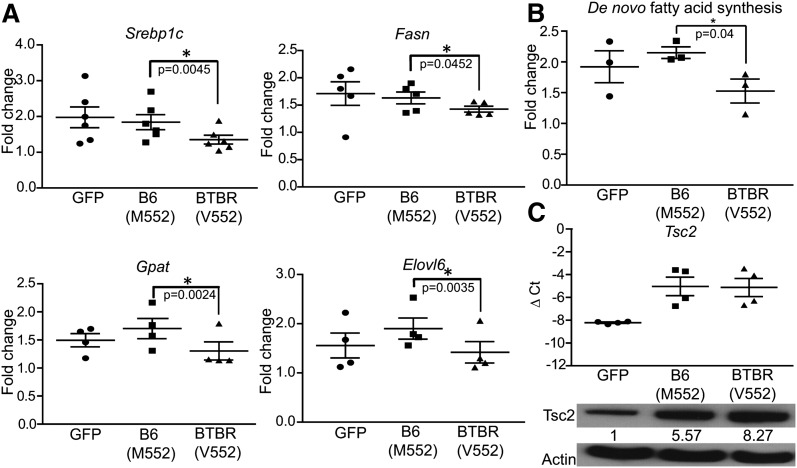
Fig. 4.
Allelic difference in regulation of lipogenesis. AML12 cells expressing GFP, B6 (M552), or BTBR (V552) alleles of Tsc2 were treated with insulin after insulin starve for 16 h. A: The expression levels of lipogenic genes were measured by real-time PCR and are presented as fold change after insulin induction. B: The amount of tritium incorporation into fatty acids from 3H2O was used as a measurement of de novo lipogenesis after insulin treatment. C: The amount of Tsc2 transcript was measured by real-time PCR in each cell population to confirm that they were expressed to comparable levels. Western blotting was performed on these cells, and the level of Tsc2 was quantified. The numbers underneath Tsc2 blot represent the relative level after correcting for Actin loading control.

